


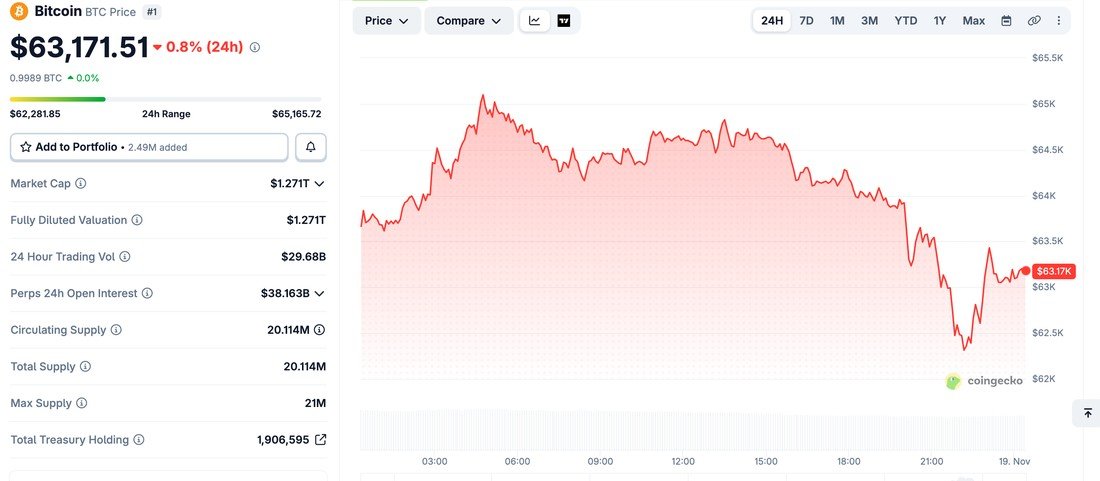
The bitcoin price prediction worth having this week is a map, not a target. Bitcoin traded near $63,200 on November 19, down 23% in 30 days and almost exactly half the $126,080 record it set in October 2025.
The weekend low of $62,612 is the line buyers have defended since. Above it sits a ceiling around $65,600 that has turned back every attempt at a bounce, and above that, nothing until $70,000.
Bitcoin Price Prediction: The Levels That Decide the Next Move
Bitcoin is trading under its 20-day, 50-day and 200-day averages at the same time, so the levels below matter more than any trend reading.
| Level | Price | What it marks |
|---|---|---|
| Realised price | $53,700 | Average cost of all coins last moved |
| June low | $58,500 | Opened by a daily close under $62,000 |
| Strong support | $62,361 | Sits on the lower Bollinger band at $62,322 |
| Spot | $63,200 | Where bitcoin trades now |
| First resistance | $65,607 | Caps the bounce attempts of the past week |
| Strong resistance | $66,583 | Needed before $70,000 is a live argument |
| 200-day average | $72,784 | The line that defines the longer trend |
The 50-day average sits at $78,700 and the 20-day at $72,882, both far overhead. Bitcoin has not closed a day above $70,000 since November 13, and it has printed 13 consecutive sessions of lower daily highs, the longest run on record.
The last 24 hours show the same squeeze, with trade running between $62,282 and $65,166. Funding on perpetual futures is barely positive at 0.006%, so the leverage that is left costs almost nothing to hold, in either direction.
What Pushed Bitcoin Down 23% in a Month
The trigger was macro, not crypto. October inflation came in at 0.4% on November 10, and traders moved from pricing a December rate rise at roughly two-in-three odds to treating it as settled. Risk assets repriced, and leverage did the rest.
- About $2 billion in leveraged positions were liquidated over the weekend
- US spot bitcoin ETFs lost $2.58 billion across the 12 sessions to November 17
- BlackRock’s IBIT accounted for $2.25 billion of that, or 87% of the total
- November is already the heaviest month of ETF withdrawals since June
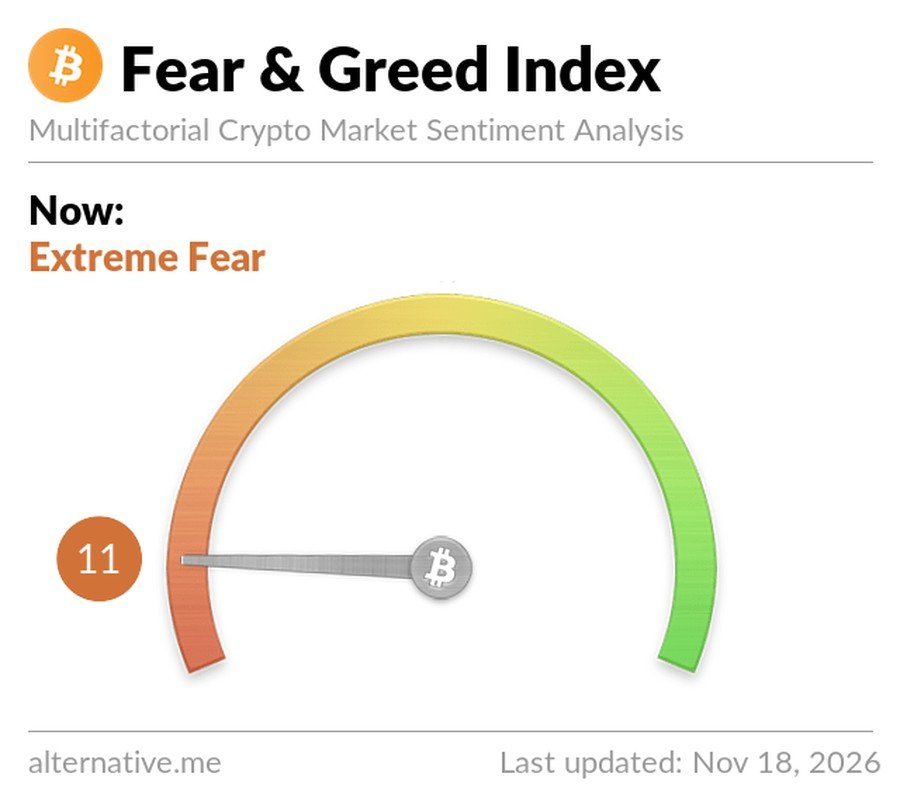
Sentiment went with it. The Crypto Fear and Greed Index reads 11, below the level it touched at June’s low, and 51.5% of all bitcoin in circulation is now held at a loss.
Ether has taken the same beating on a longer streak of fund withdrawals, which is covered in the current ethereum price prediction published alongside this one.
Why Some Analysts Are Calling a Bottom Here
The case for buying rests on exhaustion signals rather than on anything improving.
- The daily RSI fell to 19.95 on Saturday and still sits near 23, deeply oversold
- Bitcoin is 8.5% below its 200-week moving average, against 7.3% at the June low
- Short-term holders added about 66,000 BTC in the $62,000 to $66,000 band
- Leveraged ETF exposure has dropped to multi-year lows
K33 head of research Vetle Lunde called anything under $70,000 a gift from the market, noting that conditions like these have usually come before bottoms. Bitwise chief investment officer Matt Hougan argues the cause has run its course, with the rate move priced in and the leverage already flushed.
Glassnode is less convinced. Its analysts say buying demand remains thin and that a daily close under $62,000 would put August’s buyers underwater and open the road to $58,500. Positioning backs the caution: 68% of accounts on the largest exchange are still long, which leaves plenty of stops below the market.
Where Bitcoin Sits Against Its Own Record
Six straight losing weeks is rare. It has happened twice before, between January and March this year and across April and May of 2022, which is thin company for anyone drawing conclusions from the pattern.
Supply is doing what it always does. About 20.11 million of the 21 million bitcoin that will ever exist have been mined, and the market value of the lot is $1.27 trillion, down from roughly $2.5 trillion at the peak.
Nothing here is advice. Bitcoin has moved 15% in a single week this month and half its value in 13 months. Buying it with money borrowed against a card turns a volatile position into a fixed repayment, and a missed one stays on your credit score for years.
Frequently Asked Questions
What is the bitcoin price prediction for the next few weeks?
Bitcoin is boxed between $62,361 and $65,607. A daily close under $62,000 points at $58,500, the June low. A close above $66,583 makes $70,000 the next test. Everything beyond those two levels is guesswork.
Why is Bitcoin falling so hard right now?
October inflation at 0.4% turned a possible December rate rise into an expected one, which hit every risk asset. Roughly $2 billion of leveraged crypto positions were liquidated, and spot ETFs have pulled out $2.58 billion since the start of November.
How far below its all-time high is Bitcoin?
Bitcoin is about 50% below the $126,080 peak it reached on October 6, 2025. Returning there would take a double from the current price.
Is Bitcoin oversold?
By the usual measures, yes. The daily RSI dropped under 20 on Saturday, more than half of all coins are held at a loss, and the price is further below its 200-week average than it was at June’s low. Oversold is not the same as a bottom, and both can last weeks.
Related Articles

Get the Fox Bulletin briefing
The stories that matter, in your inbox. No spam, unsubscribe anytime.
Newsletter signup will be available soon.
Related stories

Ethereum Price Prediction: ETH Tests $1,700 Before $2,000
Ether trades near $1,770 after a 26% month. The levels, the ETF outflows and what a move back to $2,000 would take.

Business Name Ideas: 7 Naming Styles With Real Origins
Business name ideas in seven naming styles, each with a real brand origin and eight or more original examples, plus how to check a name with the USPTO.

How to Write a Business Plan: 8 Sections in Working Order
How to write a business plan in eight steps: what goes in each section, a bakery example for each, and when a one-page lean plan can take as little as one hour.