

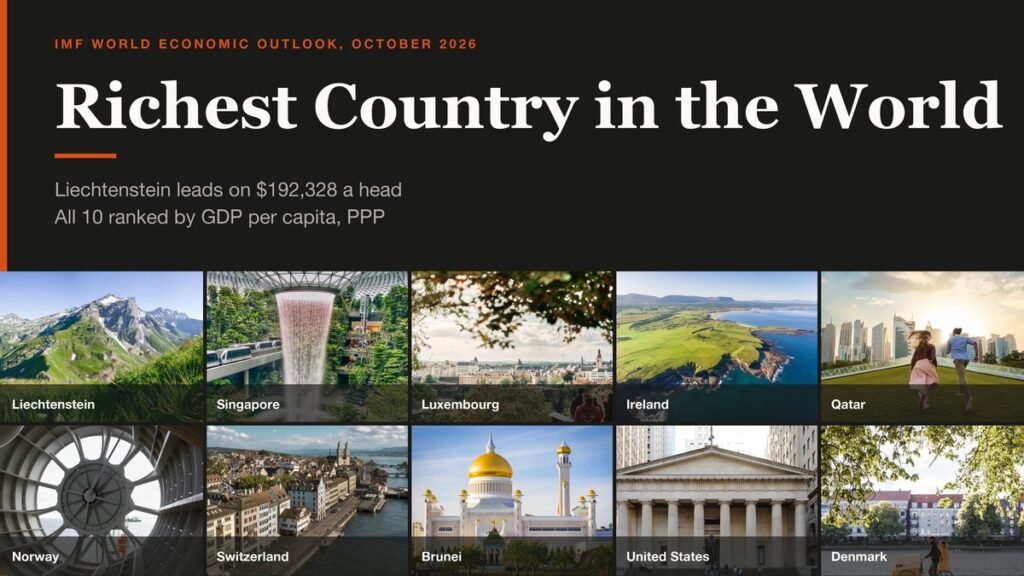
The richest country in the world by GDP per capita is Liechtenstein, at $192,328 per person in 2025 at purchasing power parity, in the International Monetary Fund’s October 2026 World Economic Outlook. Singapore ($164,244), Luxembourg ($152,894), Ireland ($147,825) and Qatar ($119,556) complete the top five.
That ranking measures output per resident, and the leaders are small: Liechtenstein has about 41,000 people and Luxembourg 0.68 million. The United States, the largest economy at $30.9 trillion, ranks ninth per person. Below, all ten are ranked with the industry behind each figure, followed by the caveats that matter: Macao, total output, 2026 projections and how much of the headline residents actually keep.
Richest Country in the World: The Short Answer and the Measure Used
Liechtenstein is the richest country in the world per person: $192,328 of GDP per capita at purchasing power parity in 2025, per the IMF’s October 2026 outlook. Singapore and Luxembourg follow. By total economic output the answer changes to the United States at $30.9 trillion, ahead of China at $19.6 trillion.
GDP per capita divides a country’s yearly output by its average population. Purchasing power parity adjusts that output for local prices, so a dollar buys the same basket everywhere, while the nominal version converts at market exchange rates. This ranking uses PPP for 2025, the latest full year in the IMF database, with nominal figures beside it. Only sovereign states are ranked.
Top 10 Richest Countries: PPP, Nominal GDP per Capita and Population
| # | Country | GDP per capita, PPP (2025) | GDP per capita, nominal (2025) | Population (millions) |
|---|---|---|---|---|
| 1 | Liechtenstein | $192,328 | $218,978 | 0.04 |
| 2 | Singapore | $164,244 | $99,365 | 6.1 |
| 3 | Luxembourg | $152,894 | $148,247 | 0.68 |
| 4 | Ireland | $147,825 | $123,789 | 5.5 |
| 5 | Qatar | $119,556 | $67,894 | 3.2 |
| 6 | Norway | $111,462 | $94,360 | 5.6 |
| 7 | Switzerland | $102,397 | $117,191 | 9.1 |
| 8 | Brunei | $94,043 | $32,634 | 0.46 |
| 9 | United States | $90,267 | $90,267 | 341.9 |
| 10 | Denmark | $87,303 | $78,587 | 6.0 |
Every row comes from the same IMF release, with PPP in international dollars and nominal figures in US dollars. Population is the IMF’s 2025 estimate.
The 10 Richest Countries and What Pays for Each
Each entry names the industry or arrangement behind the number and the statistics office, central bank or ministry that published it.
1. Liechtenstein: Factories Behind the Figure
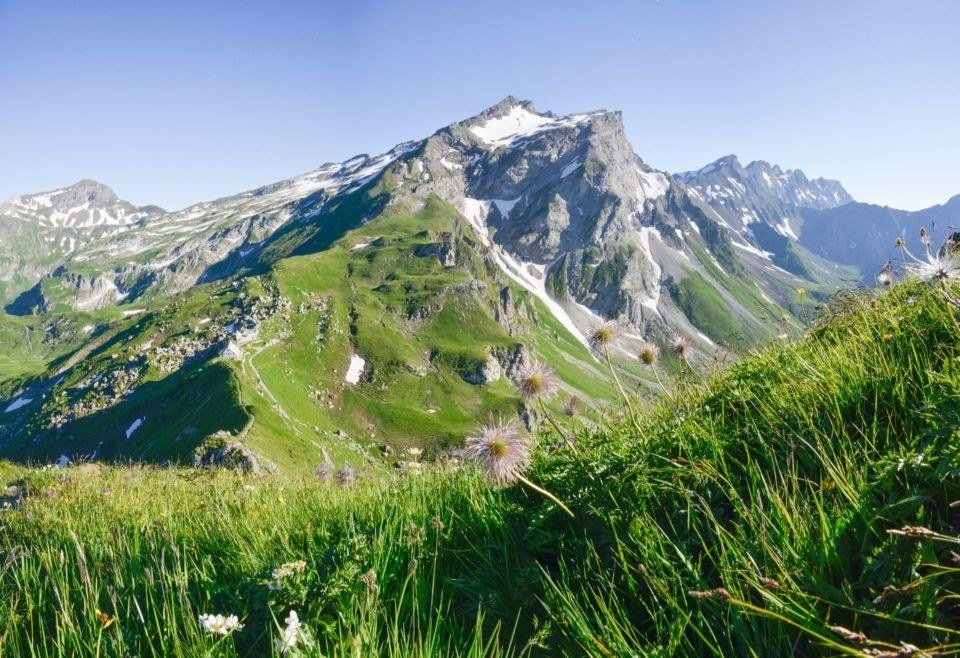
GDP per capita (PPP): $192,328 | Nominal: $218,978 | Population: about 41,000
Liechtenstein’s output is dominated by industry. The government reports that industry and manufacturing produced 42.2 percent of gross value added in 2022, CHF 2.9 billion against CHF 3.9 billion for services. The IMF lists machine and tool engineering, plant construction and precision and dental instruments as strengths, and puts finance at roughly 20 percent of GDP.
The country has more jobs than people. In 2023 it counted 42,838 employees and 39,846 residents, so workers commute in from Switzerland and Austria while output is divided among residents only. GDP per capita was CHF 186,844, against CHF 90,563 for Switzerland, in the government’s Economic and Financial Data brochure.
2. Singapore: A Port and a High Savings Rate

GDP per capita (PPP): $164,244 | Nominal: $99,365 | Population: 6.1 million
Singapore’s port handled a record 44.66 million TEUs of containers in 2025, the Maritime and Port Authority reported, plus a record 3.22 billion gross tonnes of vessel arrivals and 56.77 million tonnes of marine fuel sold to ships.
The national statistics show how the headline is trimmed. GDP per capita was S$129,194 in 2025 and gross national income per capita S$107,365, 17 percent lower. Gross national saving reached S$309.5 billion, close to 40 percent of the S$789.5 billion economy.
3. Luxembourg: The Fund Domicile

GDP per capita (PPP): $152,894 | Nominal: $148,247 | Population: 0.68 million
Luxembourg hosts investment funds from around the world. The financial regulator, the CSSF, recorded net assets of EUR 6,731.3 billion in the country’s funds at the end of June 2026, spread over 2,968 funds, for a country of 0.68 million people.
Employment is large for the population: 512,010 employees in 2023 against 667,755 residents. The World Bank’s 2025 figures put GNI per capita at $106,640 (PPP) against GDP per capita of $156,542, a gap of 32 percent.
4. Ireland: Output That Belongs to Multinationals

GDP per capita (PPP): $147,825 | Nominal: $123,789 | Population: 5.5 million
Ireland is the most distorted of the ten. The Central Statistics Office put GDP at EUR 602.4 billion for 2025 but GNI*, its measure that strips out globalisation effects, at EUR 334.0 billion. Multinational-dominated sectors produced 50.4 percent of all value added.
Those sectors grew 14.5 percent in 2025 and pulled GDP up 8.0 percent, while GNP, which excludes multinational profits, rose only 1.0 percent. Ireland’s 5.5 million residents live in an economy where a large share of recorded output is not household income.
5. Qatar: Gas Today, More Gas by 2030

GDP per capita (PPP): $119,556 | Nominal: $67,894 | Population: 3.2 million
Qatar is a gas economy. QatarEnergy lists LNG production capacity at 77 million tonnes a year and targets 142 million tonnes by 2030. Its customer split is 80.9 percent Asia, 13.4 percent Europe and 5.7 percent Middle East and Africa.
Gas also makes the figure volatile. The IMF’s October 2026 data cut Qatar from $119,556 in 2025 to a projected $103,804 in 2026, and its country page shows 2026 real GDP projected to shrink 8.6 percent.
6. Norway: The Oil Was Saved
GDP per capita (PPP): $111,462 | Nominal: $94,360 | Population: 5.6 million
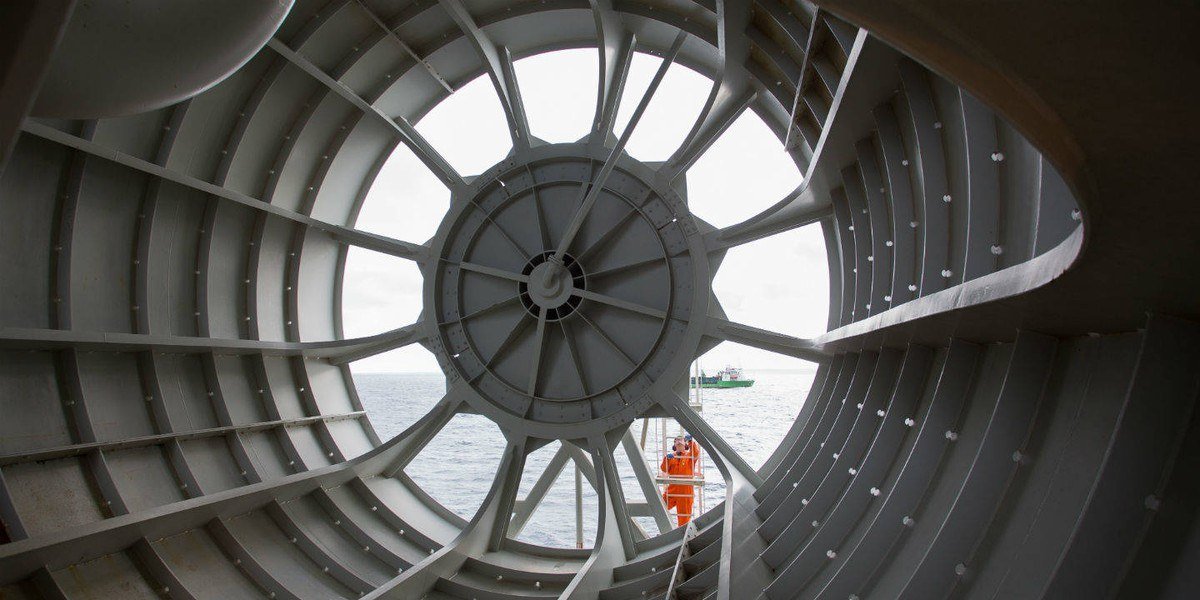
Norway invested its petroleum income. The Government Pension Fund Global was worth NOK 22,683 billion on 30 June 2026 after a 9.4 percent first-half return, with 72.1 percent in equities, Norges Bank Investment Management reported.
Divided among 5.6 million residents, that is about NOK 4 million each. Income earned abroad lifts national income above output: World Bank GNI per capita (PPP) of $107,770 in 2025 is above GDP per capita of $104,044, the reverse of Ireland and Luxembourg.
7. Switzerland: Pharmaceuticals Carry the Exports
GDP per capita (PPP): $102,397 | Nominal: $117,191 | Population: 9.1 million
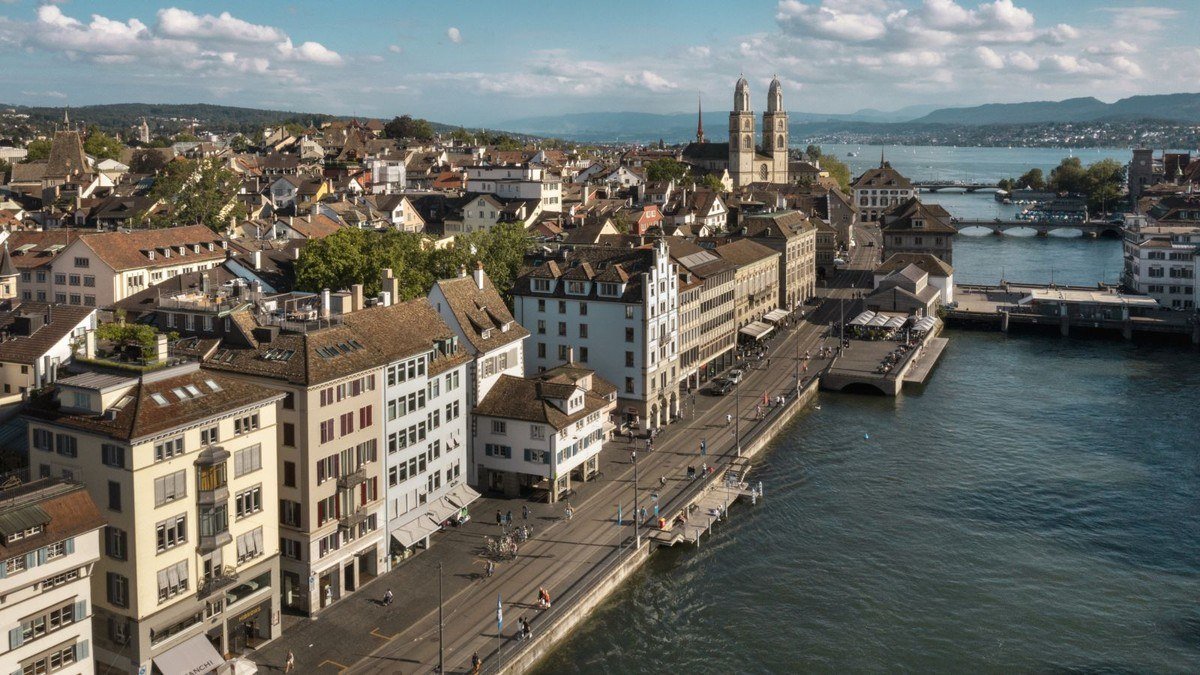
Swiss exports reached a record CHF 287.0 billion in 2025, and chemicals and pharmaceuticals made up CHF 152 billion, or 53 percent, in customs data published by the State Secretariat for Economic Affairs. Serums and vaccines added CHF 5.5 billion to growth.
The older trades are slipping: watchmaking exports fell 1.7 percent and machinery and electronics 0.6 percent. The trade surplus was CHF 54.3 billion on a population of 9.1 million.
8. Brunei: Oil and Gas Pay the Government
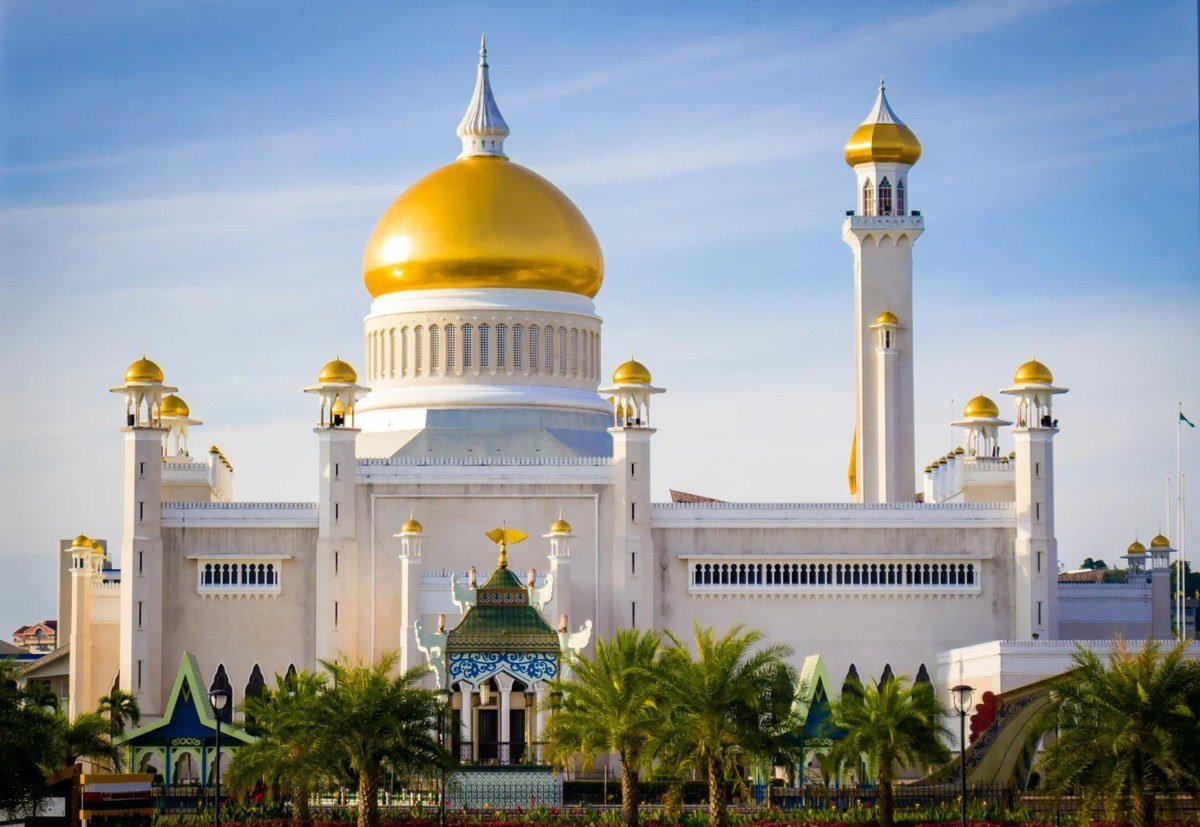
GDP per capita (PPP): $94,043 | Nominal: $32,634 | Population: 0.46 million
Brunei’s wealth is oil and gas. The Department of Economic Planning and Statistics reported that they supplied 80.2 percent of total government revenue in the third quarter of 2025, even as that revenue fell 10.7 percent from a year earlier.
Prices matter here: nominal GDP per capita is $32,634, but the IMF’s PPP figure is $94,043, nearly three times higher, because local goods and services cost far less than in the United States.
9. United States: The Only Giant on the List

GDP per capita (PPP): $90,267 | Nominal: $90,267 | Population: 341.9 million
The IMF puts 2025 US GDP at $30,861 billion across 341.9 million people, or $90,267 each, and for the United States the PPP and nominal figures are the same. Real GDP grew 2.1 percent in 2025, the Bureau of Economic Analysis reported, led by consumer spending and investment.
Scale, not a small base, makes the figure unusual. It nearly ties with Taiwan’s $90,256 and ranks ninth because eight sovereign economies produce more per resident. In the 2026 projection it slips to tenth at $95,212.
10. Denmark: Growth Led by One Industry
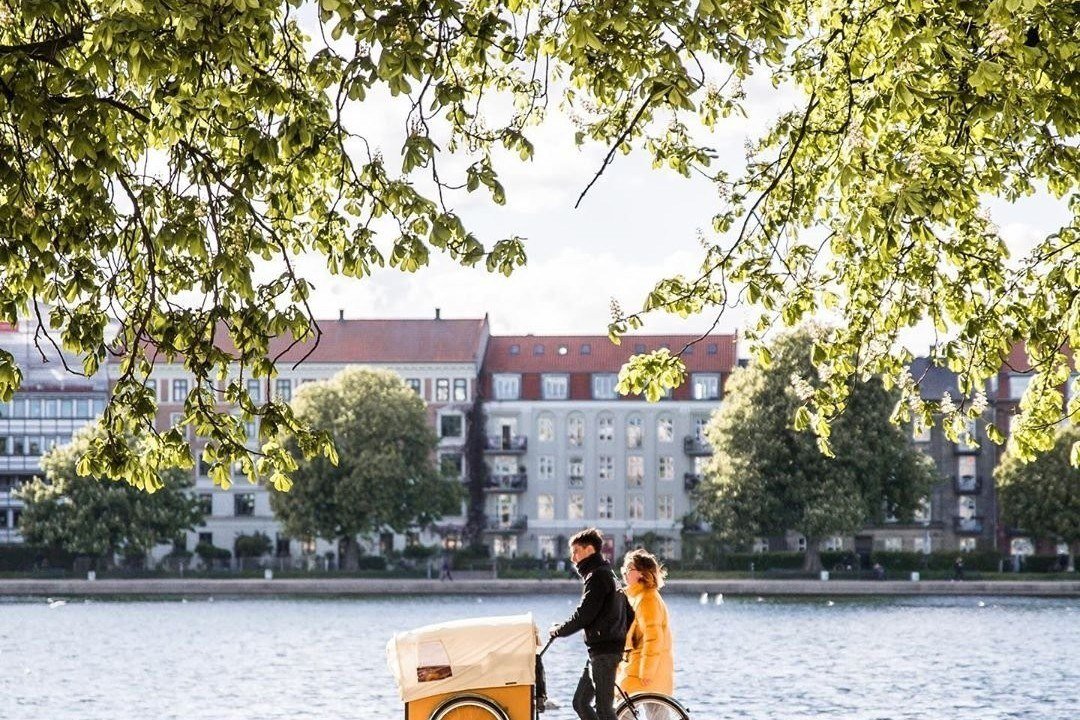
GDP per capita (PPP): $87,303 | Nominal: $78,587 | Population: 6.0 million
Denmark closes the list with a 2025 GDP of DKK 3,119 billion after 3.5 percent real growth, Statistics Denmark reported. The United Arab Emirates is next at $85,967.
Danish growth has leaned on pharmaceuticals. Industry added 2.8 percentage points to GDP growth in 2024, and pharmaceuticals alone 2.3 of them. In 2025 other sectors contributed more than pharma for the first time since 2021.
Why Macao, Hong Kong and Taiwan Are Not in the Top 10
The IMF lists Macao and Hong Kong as special administrative regions and Taiwan as a province of China, so none is ranked. Macao would come fifth at $134,421 PPP, ahead of Qatar, driven by casinos: its government reports 226.782 billion patacas of gaming revenue in 2024, about 56 percent of its 403.3 billion pataca GDP.
Taiwan’s $90,256 sits $11 below the United States, and Hong Kong’s is $80,408.
Monaco never appears because the IMF outlook does not cover it. On the World Bank’s nominal measure its GDP per capita was $288,002 in 2024, ahead of Liechtenstein’s $220,167 for the same year.
Richest Economy by Total Output: The Top 5 by GDP
A different question gets a different answer. By total nominal GDP in 2025 the IMF ranks:
- United States: $30.9 trillion
- China: $19.6 trillion
- Germany: $5.1 trillion
- Japan: $4.5 trillion
- United Kingdom: $4.0 trillion
India is sixth at $3.9 trillion. Our guide to the largest economies in the world covers that list, and the most populous countries show why population drives total output but not income per person.
How the 2026 Projections Reorder the List
The October 2026 outlook also projects 2026. Liechtenstein ($198,987), Singapore ($176,927), Luxembourg ($156,638) and Ireland ($149,642) keep the first four places, Norway moves to fifth at $116,169 and Switzerland to sixth at $106,944.
Qatar falls to seventh as its projection drops 13 percent to $103,804. Guyana rises 24 percent to $98,912 and takes eighth, as oil output averaged about 902,000 barrels a day in the first half of 2026, up from 639,000 a year earlier, according to the Guyana government. The United States slips to tenth and Denmark drops out. The IMF revises these forecasts in every outlook, so treat 2026 as an estimate.
What GDP per Capita Overstates: Ireland, Luxembourg and Singapore
GDP per capita counts everything produced inside a country, whoever owns it, and divides by residents. It is not household income. Closer measures are median household disposable income, gross national income per capita and the OECD Better Life Index. The World Bank’s 2025 figures show the gap in PPP dollars:
- Luxembourg: GDP per capita $156,542, GNI per capita $106,640, 32 percent lower
- Ireland: $155,089 falls to $106,310, 31 percent lower
- Singapore: $163,354 falls to $135,750, 17 percent lower
Ireland’s own GNI* of EUR 334.0 billion is 55 percent of its EUR 602.4 billion GDP. Norway and Denmark go the other way, with GNI per capita of $107,770 and $85,460 above GDP per capita of $104,044 and $83,218.
For a typical household, the US Census Bureau put real median household income at $87,460 in 2025, which shows the middle household rather than the average resident. For a different yardstick, see our ranking of the happiest countries in the world. This article is general information, not financial advice.
Frequently Asked Questions
Which is the richest country in the world per person?
Liechtenstein, at $192,328 of GDP per capita (PPP) in 2025 in the IMF’s October 2026 data. Singapore ($164,244) and Luxembourg ($152,894) follow. At market exchange rates Liechtenstein still leads at $218,978, then Luxembourg at $148,247.
Is the United States the richest country in the world?
By total output, yes: $30.9 trillion of GDP in 2025. Per person it ranks ninth among sovereign states at $90,267, behind eight smaller economies.
What is the richest country in Africa?
Seychelles, at $35,927 of GDP per capita (PPP) in 2025, ahead of Mauritius at $33,293 and Gabon at $25,164. That is about 19 percent of Liechtenstein’s figure.
What is the poorest country in the world?
Burundi, at $996 of GDP per capita (PPP) in 2025, followed by South Sudan at $1,413 and Yemen at $1,589. Liechtenstein’s figure is 193 times Burundi’s.
Related Articles

Get the Fox Bulletin briefing
The stories that matter, in your inbox. No spam, unsubscribe anytime.
Newsletter signup will be available soon.
Related stories

Richest Family in the World: Top 10 Dynasties Ranked
The 10 richest families from Bloomberg's December 2025 ranking, from the Waltons to the Thomsons, with the company or state behind each fortune, the stake held, the generation in control and how the money divides among heirs.

Richest Man in India: Top 10 Ranked From Adani to Mehta
The ten richest Indians on the 2026 Hurun ranking, from Gautam Adani to Samir Mehta, with the listed company, the promoter holding and the Forbes India dollar figure for each.
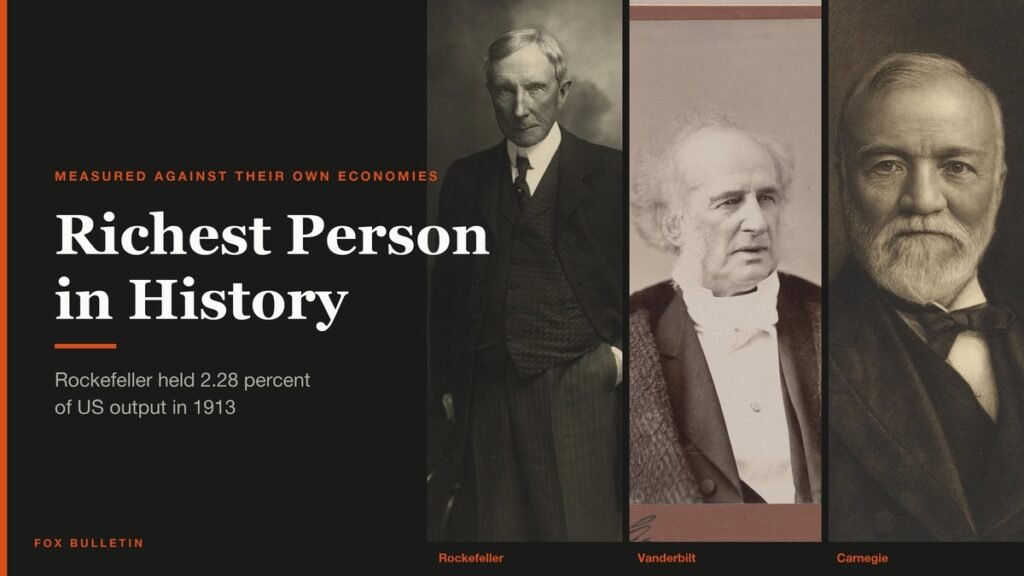
Richest Person in History: 10 Fortunes Ranked by Evidence
Ten of the largest fortunes ever, from Augustus to Rockefeller, ranked by the evidence for each, with the court record, probate value or tax revenue behind every figure and a plain note where none exists.