

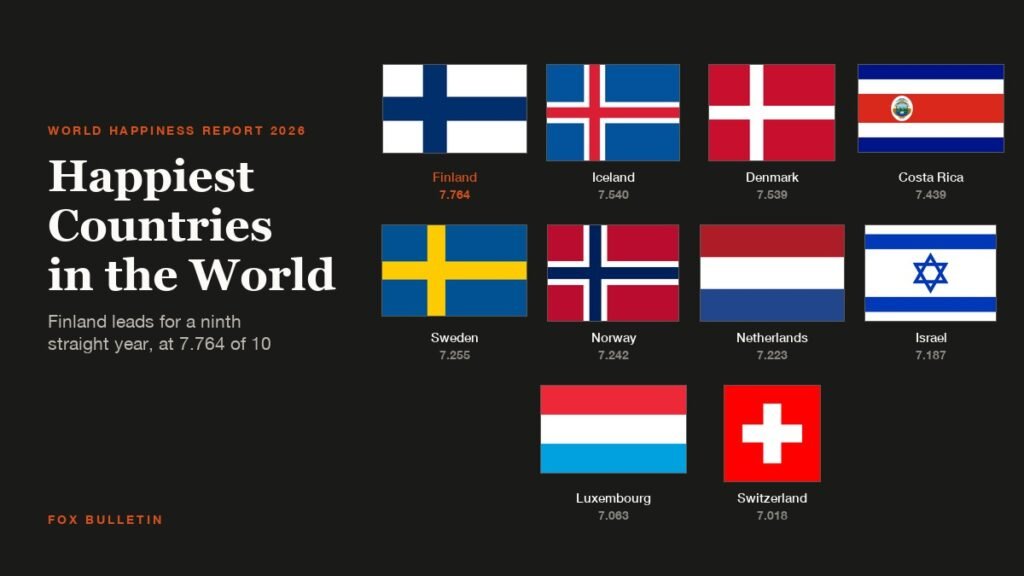
Finland is the happiest country in the world for the ninth year running, with a life evaluation score of 7.764 out of 10. The happiest countries in the world are ranked each year by the World Happiness Report, which asks people in 147 countries to rate their own lives on a ladder from 0 to 10 and then averages three years of answers to smooth out short-term noise.
Iceland takes second at 7.540, ahead of Denmark at 7.539, a gap of one thousandth of a point. Costa Rica reaches fourth at 7.439, the highest placing a Latin American country has recorded. For the second consecutive year, no English-speaking country appears in the top 10. The table lists all 10, their scores, and three of the six factors the report uses to account for where each score comes from.
| # | Country | Life evaluation score | Income contribution | Social support | Freedom |
|---|---|---|---|---|---|
| 1 | Finland | 7.764 | 1.915 | 1.638 | 1.105 |
| 2 | Iceland | 7.540 | 1.971 | 1.720 | 1.105 |
| 3 | Denmark | 7.539 | 1.986 | 1.633 | 1.081 |
| 4 | Costa Rica | 7.439 | 1.697 | 1.483 | 1.101 |
| 5 | Sweden | 7.255 | 1.950 | 1.570 | 1.070 |
| 6 | Norway | 7.242 | 2.057 | 1.626 | 1.092 |
| 7 | Netherlands | 7.223 | 1.983 | 1.539 | 1.000 |
| 8 | Israel | 7.187 | 1.867 | 1.606 | 0.863 |
| 9 | Luxembourg | 7.063 | 2.162 | 1.465 | 1.056 |
| 10 | Switzerland | 7.018 | 2.028 | 1.534 | 1.035 |
What the Score Actually Measures
The ranking is not a tally of economic output or life expectancy. It is built from a single survey question known as the Cantril ladder, in which respondents picture a ladder with the best possible life for them at step 10 and the worst at step 0, then say which step they personally stand on today.
Gallup puts that question to roughly 1,000 people per country per year through its World Poll, and the report averages the three most recent years. The 2026 edition therefore reflects answers collected from 2023 through 2025, which is why a single good or bad year moves a country only slightly. Gallup’s own explanation of the Cantril scale is the published description of how the scale is worded and administered.
Six factors are then used to explain the differences between countries rather than to produce the score: income per person, social support, healthy life expectancy, freedom to make life choices, generosity and perceptions of corruption. Each contributes a number of points, and a residual absorbs whatever the six do not account for.
- Income enters as log GDP per capita, so each doubling of income adds a fixed amount rather than a proportional one
- Social support comes from whether people say they have relatives or friends they can count on in trouble
- Healthy life expectancy uses World Health Organization life tables, not self-reported health
- Freedom to make life choices is satisfaction with freedom of choice over one’s own life
- Generosity measures charitable donation after adjusting for income
- Perceptions of corruption covers both government and business
The 10 Happiest Countries in the World, Ranked
Scores below are the three-year averages published in the 2026 edition. The factor figures in each entry are point contributions, so they are comparable across countries but do not sum to the score on their own.
1. Finland: 7.764
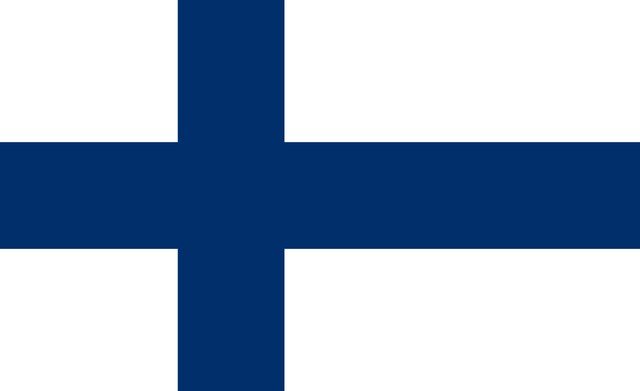
Life evaluation: 7.764 · Income contribution: 1.915 · Social support: 1.638 · Corruption contribution: 0.491
Finland has led every edition since the 2017 survey wave, nine in a row. Its score this year is 7.764, up from 7.736, a move of 0.028 points that is well inside the report’s own confidence interval of 7.690 to 7.837.
What separates Finland is not income. Norway, Luxembourg, Switzerland and Denmark all contribute more points from income per person. Finland leads the top 10 on perceptions of corruption at 0.491 points, and it ties Iceland for the highest freedom contribution at 1.105. Trust in institutions, not wealth, is the measurable difference.
2. Iceland: 7.540
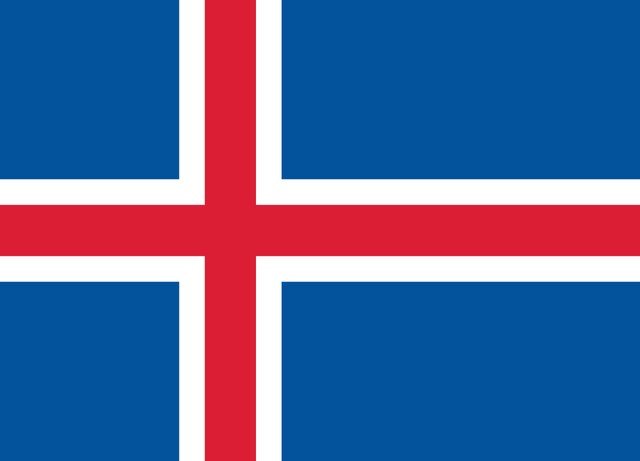
Life evaluation: 7.540 · Income contribution: 1.971 · Social support: 1.720 · Freedom: 1.105
Iceland records the strongest social support figure anywhere in the top 10 at 1.720 points, reflecting how consistently its residents say they have someone to rely on in a crisis. A population of under 400,000 spread across tight-knit communities shows up clearly in that number.
The second-place finish is decided by 0.001 points over Denmark. Both countries’ confidence intervals overlap almost entirely, Iceland’s running from 7.449 to 7.630 and Denmark’s from 7.446 to 7.631, so the order between them carries no statistical meaning.
3. Denmark: 7.539
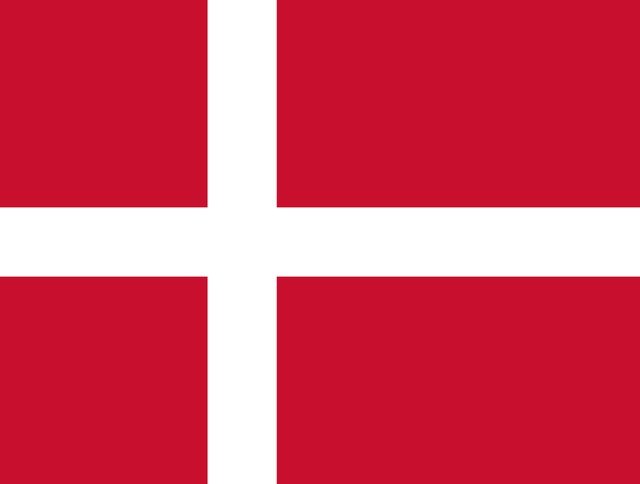
Life evaluation: 7.539 · Income contribution: 1.986 · Social support: 1.633 · Corruption contribution: 0.474
Denmark held first place in the earliest editions of the report before Finland overtook it. Its corruption contribution of 0.474 points is second only to Finland’s in the top 10, and its income contribution of 1.986 is higher than Finland’s.
The Danish result is unusually stable rather than unusually high. Across the last decade its score has moved within a narrow band, which is the pattern the three-year averaging method is designed to reveal.
4. Costa Rica: 7.439
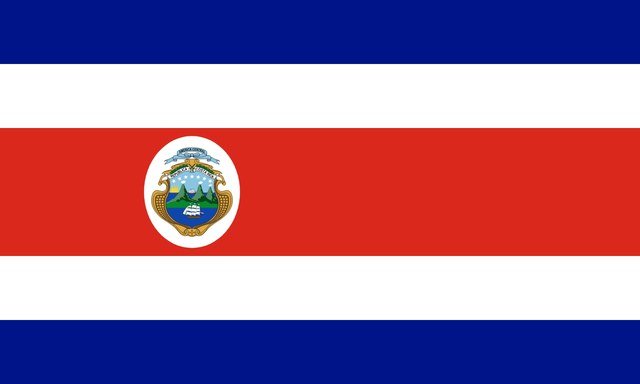
Life evaluation: 7.439 · Income contribution: 1.697 · Social support: 1.483 · Freedom: 1.101
Costa Rica is the outlier of the 2026 edition and the only country in the top 10 outside Europe and the Middle East. Its income contribution of 1.697 points is the lowest in the group, roughly a quarter below Luxembourg’s, yet it finishes fourth.
Two figures carry it. Freedom to make life choices contributes 1.101 points, within a hair of Finland’s 1.105. The residual term, which captures everything the six factors do not explain, is 2.236 points for Costa Rica against 1.582 for Finland. A large residual means the model systematically under-predicts how highly Costa Ricans rate their lives.
5. Sweden: 7.255
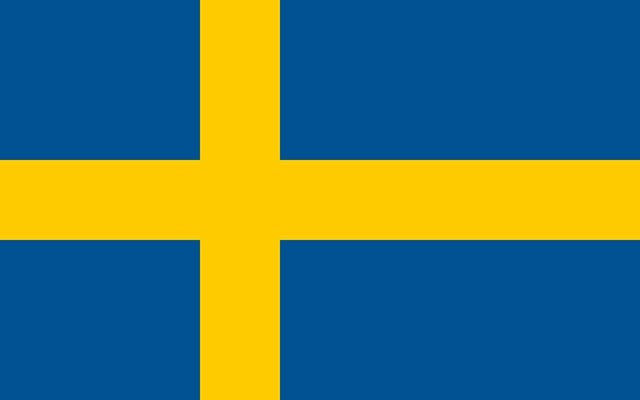
Life evaluation: 7.255 · Income contribution: 1.950 · Healthy life expectancy: 1.027 · Corruption contribution: 0.447
Sweden posts the highest healthy life expectancy contribution in the top 10 at 1.027 points, edging Switzerland’s 1.017 and Iceland’s 0.996. That factor rewards years lived in good health rather than total lifespan.
Its 7.255 opens a clear gap below the top four, with 0.184 points separating it from Costa Rica. From fifth through tenth the scores compress into a range of just 0.237 points, so small annual shifts reshuffle this part of the list.
6. Norway: 7.242
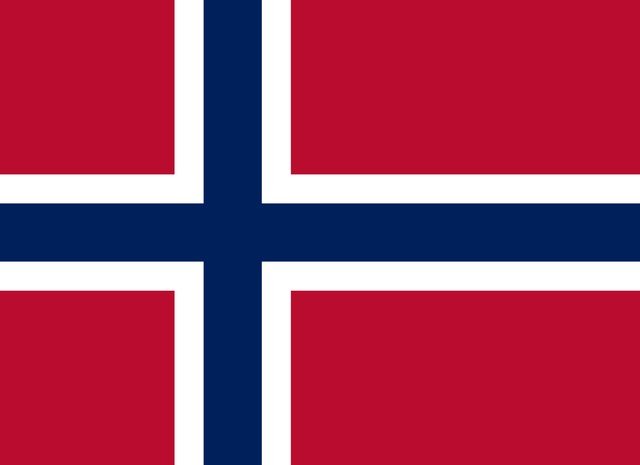
Life evaluation: 7.242 · Income contribution: 2.057 · Social support: 1.626 · Freedom: 1.092
Norway contributes 2.057 points from income per person, second only to Luxembourg in the top 10 and higher than any of the four countries placed above it. Sovereign wealth from petroleum underpins that figure.
It finishes sixth all the same, 0.522 points behind Finland. Norway topped the ranking in the 2016 survey wave, and its slide since is the clearest illustration that income contributions alone do not set the order. For a domestic parallel, our ranking of the healthiest states in the US shows the same weak link between wealth and measured wellbeing across US states.
7. Netherlands: 7.223
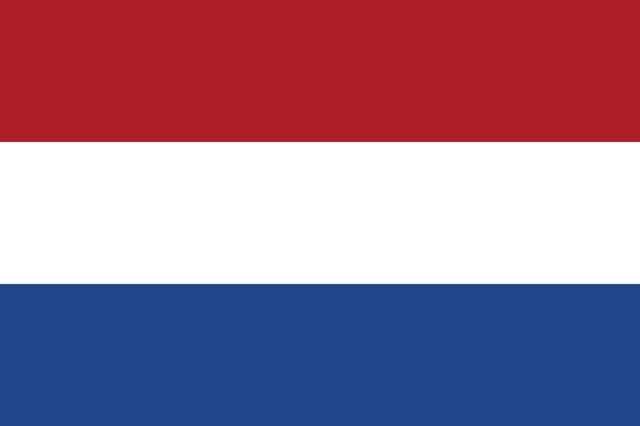
Life evaluation: 7.223 · Income contribution: 1.983 · Social support: 1.539 · Generosity: 0.175
The Netherlands is the most populous country in the top 10 at roughly 18 million people, which matters because larger populations tend to produce more varied answers and pull national averages down.
Its generosity contribution of 0.175 points is the second highest in the group behind Iceland’s 0.187. Freedom contributes exactly 1.000 points, the lowest of any country in the top 10 except Israel.
8. Israel: 7.187
Life evaluation: 7.187 · Income contribution: 1.867 · Social support: 1.606 · Freedom: 0.863
Israel has placed in the top 10 in every recent edition, and its social support contribution of 1.606 points ranks fourth in the group. Its freedom contribution of 0.863 points is the lowest in the top 10 by a wide margin, 0.137 below the Netherlands.
Because the score is a three-year average covering 2023 through 2025, it blends survey waves collected under very different national conditions. That is a general property of the method and applies to every country on the list.
9. Luxembourg: 7.063
Life evaluation: 7.063 · Income contribution: 2.162 · Social support: 1.465 · Freedom: 1.056
Luxembourg has the highest income contribution of any country in the report at 2.162 points, ahead of Norway’s 2.057. It finishes ninth, which is the single clearest case against reading the ranking as a wealth table. Our list of the largest economies in the world ranks the same economies by output instead.
Social support is where it gives ground, contributing 1.465 points, the lowest figure in the top 10. A country of roughly 670,000 people where close to half the workforce commutes in from France, Belgium and Germany produces a different social fabric from Iceland’s.
10. Switzerland: 7.018

Life evaluation: 7.018 · Income contribution: 2.028 · Healthy life expectancy: 1.017 · Corruption contribution: 0.452
Switzerland is the last country above 7.000 and topped the ranking in the 2014 survey wave. Its healthy life expectancy contribution of 1.017 points is second in the top 10, and its corruption contribution of 0.452 ranks third.
It sits 0.023 points ahead of eleventh-placed New Zealand at 6.995, a margin far smaller than the confidence interval around either score. Treat the boundary of the top 10 as arbitrary.
Why the Nordic Countries Keep Finishing First
Five of the top 10 are Nordic: Finland, Iceland, Denmark, Sweden and Norway. The pattern has held for every edition since the report began in 2012, and the factor data points to a consistent explanation rather than a single cause.
All five contribute between 0.413 and 0.491 points from perceptions of corruption. No other country in the top 10 exceeds 0.382. Low perceived corruption in government and business is the one factor on which the Nordic bloc separates cleanly from everyone else, including from richer Luxembourg and Switzerland.
Social support reinforces it. The five Nordic countries contribute between 1.570 and 1.720 points, and four of the five sit above the top-10 median. Income is not the differentiator: Costa Rica finishes fourth on an income contribution 0.465 points below Luxembourg’s, which places ninth.
Where the United States, Canada and the United Kingdom Rank
The United States places 23rd at 6.816. Canada is 25th at 6.741 and the United Kingdom 29th at 6.694. None has appeared in the top 10 in the last two editions, and no English-speaking country has.
The American figure is instructive because income is not the constraint. The US income contribution of 2.002 points is higher than Finland’s 1.915 and Iceland’s 1.971. What pulls the score down is a healthy life expectancy contribution of 0.678 points against Finland’s 0.939, a freedom contribution of 0.776 against 1.105, and a corruption contribution of 0.155 against 0.491.
New Zealand at 11th and Mexico at 12th are the closest countries to the cut, followed by Ireland at 13th, Belgium at 14th and Australia at 15th. At the other end of the 147, Afghanistan ranks last at 1.446 and Sierra Leone 146th at 3.251. Among countries people actually travel to, our list of the most visited countries in the world shows little relationship to the happiness order.
How the 2026 Edition Was Put Together
The report is published by the Wellbeing Research Centre at the University of Oxford in partnership with Gallup, the United Nations Sustainable Development Solutions Network and an independent editorial board. Gallup supplies the survey data through its World Poll, which has run in more than 140 countries since 2005.
Every country ranked in the 2026 edition carries a published 95% confidence interval. Finland’s runs from 7.690 to 7.837 and Switzerland’s from 6.937 to 7.099, which is why neighbouring positions should not be read as meaningful gaps. The statistical appendix for chapter 2 sets out the regression used to produce the six factor contributions.
This year’s edition centres on social media and wellbeing, examining the finding that young people in North America and Western Europe report markedly lower life evaluations than they did 15 years ago, and testing whether social media use accounts for it.
Reading the Rankings Without Overreading Them
Three habits make the list more useful. First, compare scores rather than ranks. The difference between 2nd and 3rd is 0.001 points while the difference between 1st and 2nd is 0.224, so rank numbers compress very unequal distances.
Second, check the confidence interval before calling a change real. A country that moves three places on a 0.03-point shift has not changed in any measurable way.
Third, remember the question being asked. The ladder measures how people evaluate their own lives overall, which is a different thing from how much they smiled yesterday or how little they worried. Countries can rank well on one and poorly on another.
Frequently Asked Questions
Which is the happiest country in the world?
Finland, with a life evaluation score of 7.764 out of 10 in the World Happiness Report 2026. It is Finland’s ninth consecutive year in first place, a run that began with the 2017 survey wave.
How many countries are in the happiness ranking?
147 countries are ranked in the 2026 edition. A country needs enough Gallup World Poll responses across the three-year window to be included, so the total changes from year to year. The 2022 edition covered 137.
Where does the United States rank?
The United States ranks 23rd with a score of 6.816. Its income contribution is higher than Finland’s, but its contributions from healthy life expectancy, freedom and perceptions of corruption are all substantially lower.
Why is Costa Rica so high in the ranking?
Costa Rica reaches fourth at 7.439 on a freedom contribution of 1.101 points, essentially level with Finland’s, and the largest unexplained residual in the top 10 at 2.236 points. People there rate their lives more highly than the six measured factors predict.
Related Articles

Get the Fox Bulletin briefing
The stories that matter, in your inbox. No spam, unsubscribe anytime.
Newsletter signup will be available soon.
Related stories

Best Oversized T-Shirts for Women: 7 Compared
The best oversized t-shirts for women differ from each other in three places: what the fabric is made of, where the shoulder seam sits and how the hem is shaped. Those three…
Best Oversized T-Shirts for Men: 7 Picks Compared
The best oversized t-shirts for men are not simply large t-shirts. The shape comes from where the shoulder seam sits and how much the fabric weighs, which is why a Pro Club…
Best Adjustable Dumbbells: 7 Picks by Weight Range
Seven adjustable dumbbell sets compared on weight range, adjustment mechanism and increments, from a 90lb selector pair to a plate-loaded starter set.