

Anchorage, Alaska is the coldest city in the US among cities of 50,000 or more people, with an annual mean temperature of 37.6 F (3.1 C). The coldest cities in the US by that measure run from Anchorage down to Rochester, Minnesota, at 44.8 F (7.1 C), a spread of only 7.2 F across the whole top ten. The table below uses the 1991-2020 climate normals, the current 30-year edition.
Every city here has at least 50,000 residents in the Census Bureau’s Vintage 2025 estimates, and each is measured at its principal airport or weather service station. Fairbanks, Utqiagvik and a few other places are colder than any of these ten, but they fall under the population cutoff and get their own section below instead of a rank.
Coldest US Cities of 50,000 or More by Annual Mean Temperature, All 10
| # | City | Annual mean | Coldest month mean | Record low | Population |
|---|---|---|---|---|---|
| 1 | Anchorage, Alaska | 37.6 F (3.1 C) | 16.9 F (January) | -34 F | 287,155 |
| 2 | Grand Forks, North Dakota | 39.8 F (4.3 C) | 6.3 F (January) | -43 F | 60,365 |
| 3 | Duluth, Minnesota | 40.6 F (4.8 C) | 11.2 F (January) | -39 F | 88,330 |
| 4 | Fargo, North Dakota | 42.2 F (5.7 C) | 9.2 F (January) | -39 F | 136,275 |
| T5 | St. Cloud, Minnesota | 42.9 F (6.1 C) | 11.8 F (January) | -43 F | 72,647 |
| T5 | Bozeman, Montana | 42.9 F (6.1 C) | 20.7 F (December) | -46 F | 58,814 |
| 7 | Bismarck, North Dakota | 43.1 F (6.2 C) | 12.8 F (January) | -45 F | 77,963 |
| 8 | Idaho Falls, Idaho | 44.2 F (6.8 C) | 20.4 F (January) | -38 F | 71,785 |
| 9 | Great Falls, Montana | 44.6 F (7.0 C) | 25.2 F (January) | -43 F | 60,208 |
| 10 | Rochester, Minnesota | 44.8 F (7.1 C) | 14.7 F (January) | -42 F | 124,292 |
St. Cloud and Bozeman share fifth place at 42.9 F, so the next city, Bismarck, is seventh. Record lows are the lowest daily minimum in each station’s history, and populations are 2025 estimates.
Coldest Cities in the US, Ranked
1. Anchorage: A Northern Lights City With a Mild January
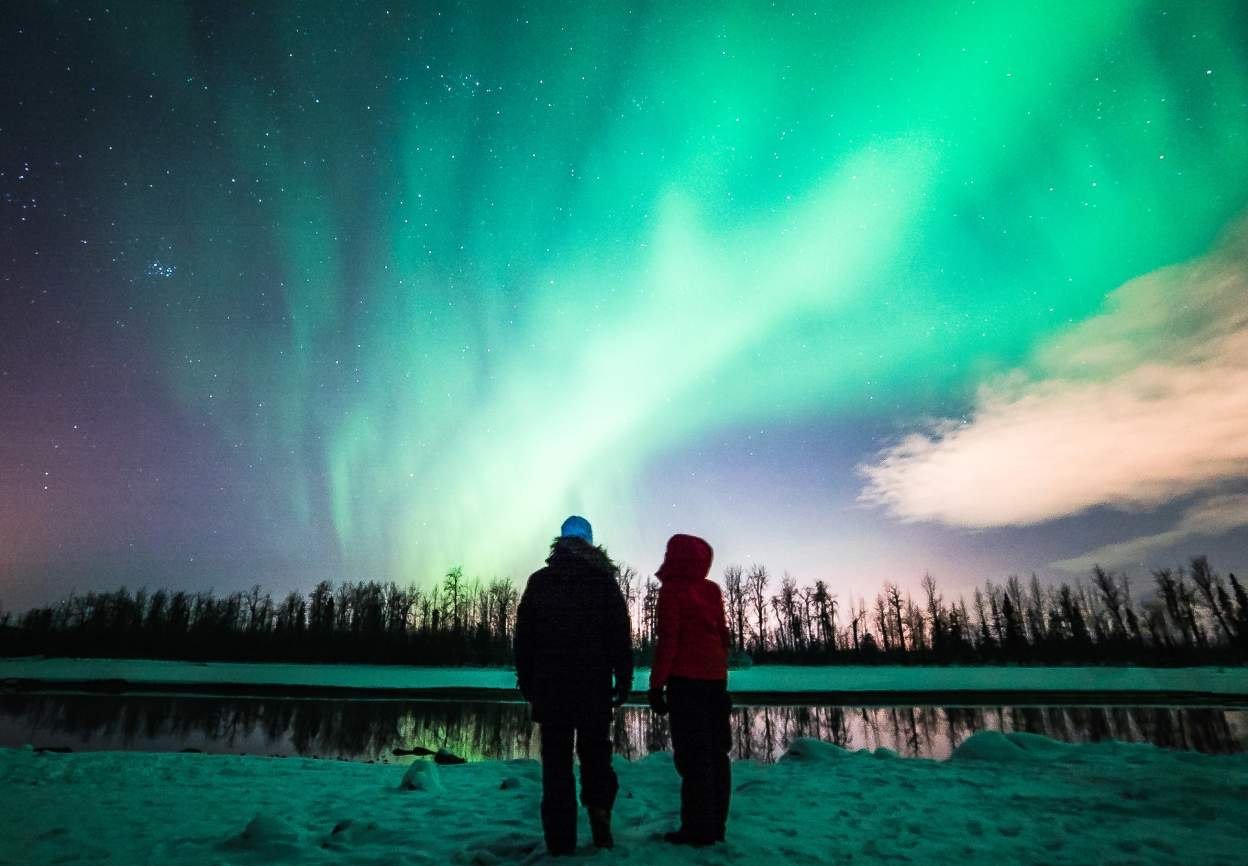
Annual mean: 37.6 F (3.1 C) · January mean: 16.9 F (-8.4 C) · Record low: -34 F (1975-01-05) · Population: 287,155
Anchorage leads the ranking by 2.2 F over Grand Forks,. Its average January low is 11.0 F (-11.7 C). The weather station at the airport has recorded temperatures since 1952, and the city is a consolidated municipality.
The surprise is how mild the depths of winter are for a city at the top of the list. Anchorage’s January mean is warmer than Fargo’s 9.2 F, Duluth’s 11.2 F and Grand Forks’s 6.3 F, a gap that the ocean influence on the Alaska coast explains. Its record low of -34 F on 1975-01-05 is the mildest record of the ten, so the top spot comes from a year that stays cold throughout, not from extreme single nights.
2. Grand Forks: The Coldest January of the Ten

Annual mean: 39.8 F (4.3 C) · January mean: 6.3 F (-14.3 C) · Average January low: -3.1 F (-19.5 C) · Record low: -43 F (2004-01-30)
Grand Forks, North Dakota is the coldest city in the lower 48 among cities of 50,000 or more, at 39.8 F. Its January mean of 6.3 F is the lowest of any city in the ranking, and it is the only one whose average January low, -3.1 F, falls below zero.
The coldest night on record at the airport station was -43 F on 2004-01-30, measured in a record that begins in 1965. The photo shows a crowd at the town square farmers market.
3. Duluth: Lake-Side Cold at Canal Park

Annual mean: 40.6 F (4.8 C) · January mean: 11.2 F (-11.6 C) · Average January low: 2.4 F (-16.4 C) · Record low: -39 F (1996-02-02)
Duluth, Minnesota comes third at 40.6 F, 0.8 F behind Grand Forks. Its January mean is 11.2 F, with an average low of 2.4 F (-16.4 C).
The station record starts in 1898, one of the longest in the ranking, and the lowest daily minimum in it is -39 F on 1996-02-02. That was one day after Fargo logged the same -39 F. The population is 88,330, which makes Duluth the fourth-largest city in the top ten, after Anchorage, Fargo and Rochester.
4. Fargo: Colder in January Than Anchorage by 7.7 Degrees

Annual mean: 42.2 F (5.7 C) · January mean: 9.2 F (-12.7 C) · Average January low: 0.2 F (-17.7 C) · Record low: -39 F (1996-02-01)
Fargo, North Dakota averages 42.2 F over the year, 4.6 F warmer than Anchorage, yet its January mean of 9.2 F is 7.7 F colder than Anchorage’s. The photo shows the Fargo-Moorhead skyline at night in snow, with the Hjemkomst Center roof and a Viking ship replica church in the foreground.
With 136,275 residents, Fargo is the second-largest city in the top ten after Anchorage. Its airport station has records back to 1891, and the lowest minimum is -39 F on 1996-02-01. The average January low of 0.2 F sits just above zero, so a typical January night is close to zero.
5 (tie). St. Cloud: Level With Bozeman at 42.9 F
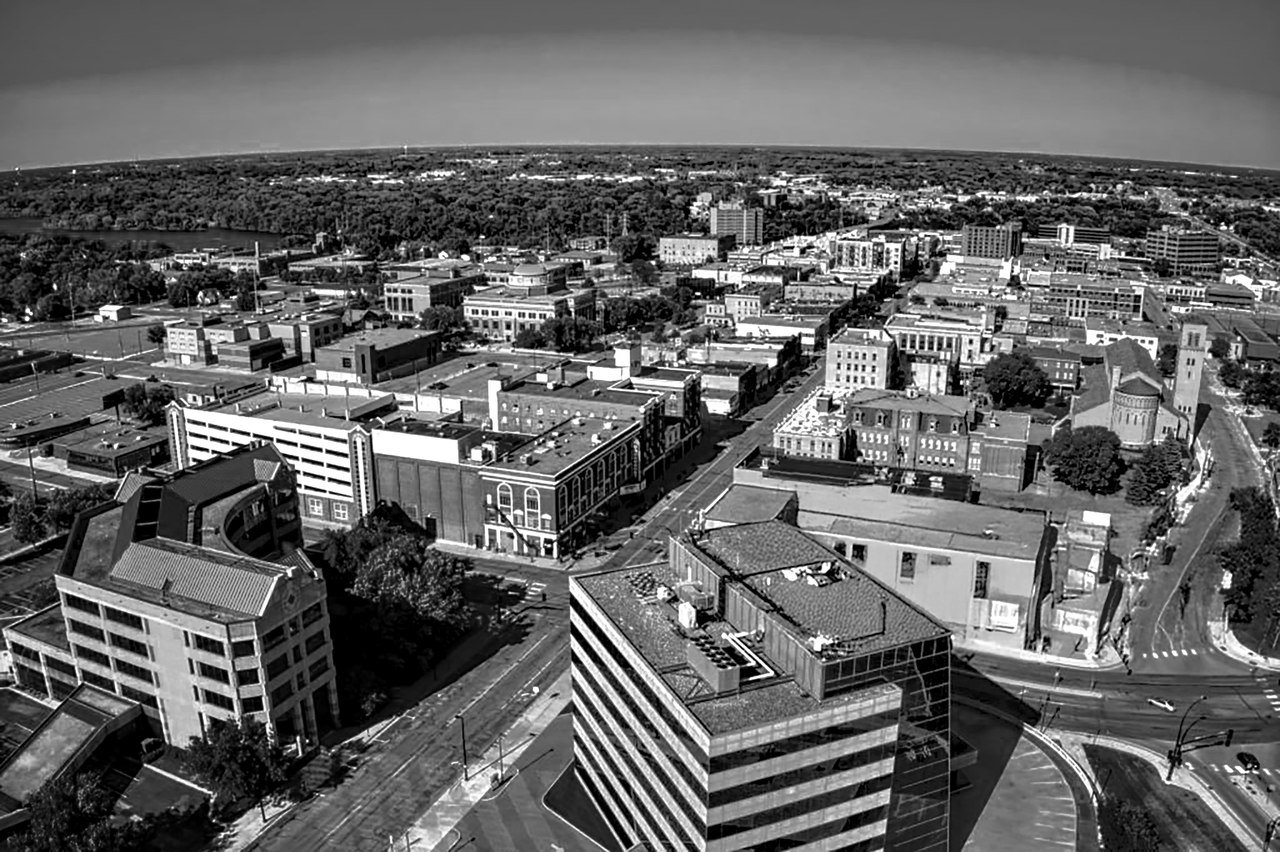
Annual mean: 42.9 F (6.1 C) · January mean: 11.8 F (-11.2 C) · Average January low: 2.9 F (-16.2 C) · Record low: -43 F (1977-01-09)
St. Cloud, Minnesota and Bozeman, Montana are tied. Both come out at 42.9 F (6.1 C) to the first decimal place, so neither is ahead of the other, and both take fifth place with Bismarck following in seventh.
Where they differ is the winter profile. St. Cloud’s January mean is 11.8 F, against Bozeman’s December mean of 20.7 F, so the Minnesota city has the colder winter and the Montana city has the cooler remainder of the year. St. Cloud’s record low is -43 F on 1977-01-09, in a station record that opens in 1896, and its population is 72,647.
5 (tie). Bozeman: A Dinosaur at Dusk and the Deepest Record Low

Annual mean: 42.9 F (6.1 C) · December mean: 20.7 F (-6.3 C) · Average December low: 9.7 F (-12.4 C) · Record low: -46 F (1983-12-24)
Bozeman shares fifth place with St. Cloud at 42.9 F. Its coldest month is December, not January, with a mean of 20.7 F and an average low of 9.7 F (-12.4 C). The photo shows a dinosaur skeleton and its shadow on the wall of the Museum of the Rockies at dusk, a museum scene rather than a skyline.
Bozeman’s mild winter average hides the coldest night in the whole top ten: -46 F on 1983-12-24, in a station record that begins in 1941.
7. Bismarck: The Longest Weather Record of the Ten
Annual mean: 43.1 F (6.2 C) · January mean: 12.8 F (-10.7 C) · Average January low: 2.4 F (-16.4 C) · Record low: -45 F (1936-02-16)
Bismarck, North Dakota is seventh at 43.1 F, just 0.2 F behind the tied pair. Its station record begins in 1874, the longest of the ten, The January mean is 12.8 F, and the average January low of 2.4 F matches Duluth’s.
The record low of -45 F on 1936-02-16 is the second-deepest in the ranking after Bozeman’s -46 F. It has stood for ninety years, and no night at the station has gone lower since.
8. Idaho Falls: A Life-Size Mammoth Indoors

Annual mean: 44.2 F (6.8 C) · January mean: 20.4 F (-6.4 C) · Average January low: 12.1 F (-11.1 C) · Record low: -38 F (1985-02-01)
Idaho Falls, Idaho averages 44.2 F, 1.1 F warmer than Bismarck. Its January mean of 20.4 F is the third-mildest coldest-month figure in the ranking, behind only Great Falls and Bozeman. The photo shows a life-size mammoth model in the Carr Family Atrium of a museum in the city, not an outdoor view.
The record low is -38 F on 1985-02-01, in a station record that begins in 1948, and only Anchorage has a milder record in the top ten.
9. Great Falls: The Mildest Winter in the Top Ten

Annual mean: 44.6 F (7.0 C) · January mean: 25.2 F (-3.8 C) · Average January low: 15.0 F (-9.4 C) · Record low: -43 F (1968-12-29)
Great Falls, Montana comes ninth at 44.6 F. Its January mean of 25.2 F is the mildest coldest-month figure of the ten, and its average January low of 15.0 F is the highest. The photo shows the city from above, with the brick train depot clock tower and mountains beyond.
The record low is -43 F on 1968-12-29, 58 F below the average January low, so the cold here is a matter of rare events more than a steady grind.
10. Rochester: Kayaks on Silver Lake and the Oldest Record Low

Annual mean: 44.8 F (7.1 C) · January mean: 14.7 F (-9.6 C) · Average January low: 7.0 F (-13.9 C) · Record low: -42 F (1887-01-07)
Rochester, Minnesota closes the ranking at 44.8 F, 0.2 F behind Great Falls. Its January mean of 14.7 F is colder than Anchorage’s 16.9 F, even though its annual mean is 7.2 F warmer.
The record low of -42 F was set on 1887-01-07, in the first winter of a station record that begins in 1886, which makes it the oldest record date in the top ten. Rochester has 124,292 residents, the third-largest population of the ten after Anchorage and Fargo.
Fairbanks, Utqiagvik, Hibbing and International Falls: Colder Places Under 50,000
Several places beat Anchorage on cold but are not ranked, because each falls under the 50,000 threshold. Fairbanks, Alaska has an annual mean of 28.3 F (-2.1 C), a January mean of -8.3 F (-22.4 C) and a population of 31,468. Utqiagvik, Alaska averages 13.7 F (-10.2 C) over the year, with February the coldest month at -11.9 F (-24.4 C).
Two Minnesota towns also run colder than Anchorage. Hibbing averages 36.9 F (2.7 C) with 15,823 residents, and International Falls averages 37.4 F (3.0 C) with 5,481. Record lows there are deeper than any ranked city’s: -66 F in Fairbanks on 1934-01-14, -56 F in Utqiagvik, -55 F in International Falls on 1909-01-06 and -50 F in Hibbing.
Plains, Mountains and Coast: Where the Cold Comes From
The ranking splits into three climates. Minnesota and North Dakota hold six of the ten places: Duluth, St. Cloud and Rochester in Minnesota, Grand Forks, Fargo and Bismarck in North Dakota.
Montana and Idaho supply three more, Bozeman, Great Falls and Idaho Falls. Their coldest-month means run from 20.4 F to 25.2 F. Anchorage, the lone coastal entry, wins on the annual mean while recording a January warmer than Fargo, Duluth and Grand Forks.
Just Outside the Top 10: Missoula, Casper and Minneapolis
The cutoff at tenth place is thin. Missoula, Montana averages 45.2 F, only 0.4 F warmer than Rochester, and Casper, Wyoming follows at 45.6 F. Cheyenne, Wyoming and Minneapolis, Minnesota are tied at 46.9 F.
Minneapolis is the coldest city above 400,000 residents among those measured, with 430,324 people. Readers comparing size can see the biggest cities in the largest cities in the US.
What the Annual Mean Measures, and What It Leaves Out
The annual mean is the average of the daily high and daily low across a year, and the figures here come from the 30-year 1991-2020 climate normals that NOAA recomputes every ten years. The coldest-month figure is the lowest of the twelve monthly means, which is January for most cities and December for Bozeman.
Several limits apply. Record lows are the lowest daily minimum in each station’s period of record, and the records begin in different years, from 1874 in Bismarck to 1965 in Grand Forks. Stations have moved over time, wind chill is not included, and ties at one decimal place are shown as ties. The ranking is built from about 50 cold-climate stations across Alaska, the northern plains, the upper Midwest, the northern Rockies and New England, so it is not a count of every US city.
How to Compare Annual Means Before a Move or a Trip
Start with the coldest-month mean, not the annual number. Anchorage leads on the annual mean, but a January in Grand Forks averages 10.6 F colder, and a traveler or new resident feels the winter month, not the yearly average.
Then look at the average low and the record low together. Fargo’s January low of 0.2 F is typical, while Bozeman’s -46 F is a rare extreme. For where living costs run lowest, see the cheapest states to live in.
Frequently Asked Questions
What is the coldest city in the US?
Among cities of 50,000 or more, Anchorage is coldest at 37.6 F (3.1 C), measured by the 1991-2020 annual mean. Among smaller places, Fairbanks averages 28.3 F and Utqiagvik 13.7 F.
What is the coldest city in the lower 48 with 50,000 people?
Grand Forks, North Dakota, at 39.8 F (4.3 C), with a January mean of 6.3 F and an average January low of -3.1 F. Duluth, Minnesota follows at 40.6 F.
What is the coldest temperature ever recorded in these cities?
Among the ten ranked cities, Bozeman holds the deepest record, -46 F on 1983-12-24, followed by Bismarck at -45 F. Fairbanks, which is not ranked, recorded -66 F (-54.4 C) on 1934-01-14.
Does the ranking include wind chill?
No. The figures are air temperatures only, averaged over 30 years. Wind chill is not part of the annual mean, the coldest-month mean or the record lows.
Related Articles

Get the Fox Bulletin briefing
The stories that matter, in your inbox. No spam, unsubscribe anytime.
Newsletter signup will be available soon.
Related stories

Longest Rivers in the World: Top 10 Ranked by Length
The Nile is the longest river in the world at about 6,650 km, with the Amazon and Yangtze close behind. This ranking covers the ten longest river systems with their length, basin size and discharge, and explains why the Nile and Amazon are measured so differently.

Most Expensive Cities in the World: Top 10 Ranked
Hong Kong is the most expensive city in the world for international employees, ahead of Singapore and Zurich. This ranking covers the top 10 with rank changes, cost indexes where published and the forces behind each position.

Average Height by Country: The 10 Tallest Nations Ranked
The Netherlands has the tallest young men of any country, at an estimated 183.8 cm (6 ft 0.4 in). This ranking covers the top 10 countries with men's and women's heights in cm and feet and inches. It also shows how the United States, United Kingdom, China and India compare and which countries sit at the bottom.